


Finite Element Analysis
Finite Element Model
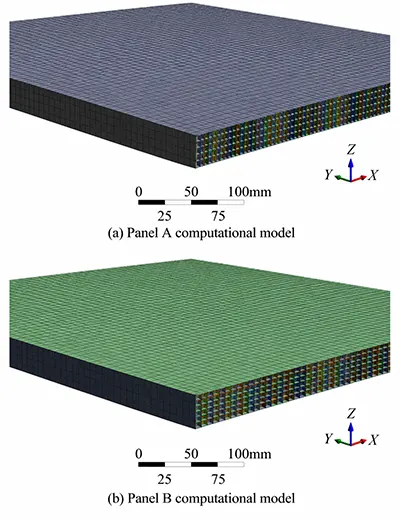
The study uses ANSYS finite element software to simulate the panels under geometrically nonlinear elastic assumptions. Figure 16 illustrates the numerical models of Panels A and B.
Fixed hinged supports occupy opposite long edges at 600 mm intervals. Each support measures 120 mm in length.
Both models have a longitudinal dimension of 1,800 mm, covering three support intervals. Their short-span widths are 1.05 m for Panel A and 1.04 m for Panel B.
The numerical models use shell elements to represent the panel structures. Mesh element sizes remain within 10 mm to maintain suitable element quality.
Finite Element Calculation Results
Tables 9 and 10 present the finite element displacement results for Panel A under positive and negative pressures. Tables 11 and 12 provide corresponding results for Panel B.
| Parameter | 0.5 | 2.5 | 3.74 | 4.5 | 5.5 |
|---|---|---|---|---|---|
| Positive Pressure (kPa) | 0.5 | 2.5 | 3.74 | 4.5 | 5.5 |
| Maximum Vertical Displacement (mm) | 9.2 | 29.3 | 36.3 | 39.8 | 43.7 |
Table 9. Finite Element Maximum Vertical Displacement of Panel A Under Positive Pressure
| Parameter | −0.7 | −1.4 | −2.1 |
|---|---|---|---|
| Negative Pressure (kPa) | −0.7 | −1.4 | −2.1 |
| Maximum Vertical Displacement (mm) | 13.0 | 21.6 | 27.7 |
Table 10. Finite Element Maximum Vertical Displacement of Panel A Under Negative Pressure
| Parameter | 0.5 | 2.5 | 3.74 | 4.5 |
|---|---|---|---|---|
| Positive Pressure (kPa) | 0.5 | 2.5 | 3.74 | 4.5 |
| Maximum Vertical Displacement (mm) | 7.0 | 24.9 | 31.3 | 34.5 |
Table 11. Finite Element Maximum Vertical Displacement of Panel B Under Positive Pressure
| Parameter | −0.7 | −1.4 | −2.1 | −3.0 | −3.5 |
|---|---|---|---|---|---|
| Negative Pressure (kPa) | −0.7 | −1.4 | −2.1 | −3.0 | −3.5 |
| Maximum Vertical Displacement (mm) | 9.9 | 17.00 | 23.4 | 27.8 | 30.3 |
Table 12. Finite Element Maximum Vertical Displacement of Panel B Under Negative Pressure
The numerical results also show a nonlinear positive relationship between pressure and maximum vertical displacement. As pressure increases, displacement continues growing while its rate of increase gradually declines.
Maximum Vertical Displacement Calculation Formula for U-Shaped Hollow Panels
The previous analyses show substantial differences between theoretical, finite element, and experimental displacement results. Therefore, neither conventional small-displacement theory nor unadjusted finite element results can directly represent experimental behavior.
The proposed method introduces a displacement reduction coefficient η to account for large-displacement effects. This coefficient equals the ratio between nonlinear finite element displacement ω2 and theoretical displacement ω1.
An additional adjustment coefficient γ accounts for differences between experimental displacement ω3 and nonlinear finite element displacement ω2. It represents influences such as boundary conditions and loading direction.
The resulting maximum vertical displacement equation modifies the conventional thin-plate expression. Equation (5) presents the proposed calculation method.
Determination of the Displacement Reduction Coefficient
The displacement reduction coefficient η primarily depends on the ratio ω/teq, which directly reflects large-displacement behavior. Equations (1) and (2) establish the relevant relationships among displacement, loading, and bending stiffness.
Vertical displacement increases with qa4/D, while bending stiffness increases with Eteq3. Therefore, ω/teq correlates with qa4/(Eteq4).
The study introduces a dimensionless displacement reduction parameter θ to represent this relationship. This parameter allows η to follow a unified relationship with the loading and stiffness variables.
Tables 13 and 14 present the relationships between η and θ under positive and negative pressures. Researchers calculate these values using corresponding loading conditions.
| Parameter | 1 | 2 | 3 | 4 | 5 | 6 | 7 | 8 | 9 |
|---|---|---|---|---|---|---|---|---|---|
| θ | 3.4 | 5.3 | 16.8 | 25.2 | 26.4 | 30.3 | 39.5 | 47.5 | 58.1 |
| η | 0.97 | 0.90 | 0.69 | 0.58 | 0.57 | 0.53 | 0.47 | 0.43 | 0.39 |
Table 13. Relationship Between η and θ Under Positive Pressure
| Parameter | 1 | 2 | 3 | 4 | 5 | 6 | 7 | 8 |
|---|---|---|---|---|---|---|---|---|
| θ | 7.4 | 14.8 | 22.2 | 4.7 | 9.4 | 14.1 | 20.2 | 23.5 |
| η | 0.91 | 0.75 | 0.64 | 0.98 | 0.84 | 0.77 | 0.64 | 0.60 |
Table 14. Relationship Between η and θ Under Negative Pressure
The study plots these values as scatter points and applies an exponential fitting function. Figure 17 illustrates the resulting relationship between η and θ.
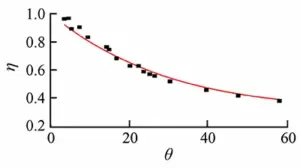
The fitted curve shows that η gradually decreases as θ increases. Its value approaches 0.30, giving an overall range of 0.30 to 1.00.
The coefficient of determination for Equation (6) is R2 = 0.96755. This value exceeds 0.95, indicating satisfactory fitting accuracy.
Figure 18 compares the displacement reduction coefficients of U-shaped hollow panels, aluminum panels, and glass panels. Their coefficient curves exhibit similar overall trends.
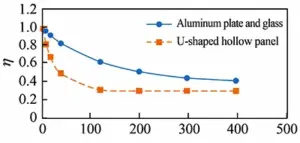
Polycarbonate has approximately one-thirtieth the elastic modulus of glass, making large-displacement effects appear earlier and more prominently. When θ reaches 100 or more, changes in η become relatively small.
The displacement reduction coefficients for aluminum and glass approach 0.40. In comparison, the corresponding coefficient for U-shaped hollow panels approaches 0.30.
Determination of the Adjustment Coefficient
Actual support connections differ from ideal hinged boundary conditions. Their rotational stiffness also varies between positive and negative vertical loading directions.
The adjustment coefficient γ accounts for support connection details and loading direction. Tables 15 and 16 present calculated values for Panels A and B.
| Panel | Panel A | Panel B | |||||||
|---|---|---|---|---|---|---|---|---|---|
| θ | 5.3 | 26.4 | 39.5 | 47.5 | 58.1 | 3.4 | 16.8 | 25.2 | 30.3 |
| γ | 0.4 | 0.9 | 1.0 | 1.0 | 1.1 | 1.4 | 1.2 | 1.3 | 1.3 |
Table 15. Adjustment Coefficient γ Under Positive Pressure
| Panel | Panel A | Panel B | ||||||
|---|---|---|---|---|---|---|---|---|
| θ | 7.39 | 14.79 | 22.18 | 4.7 | 9.4 | 14.1 | 20.2 | 23.5 |
| γ | 1.3 | 1.5 | 1.5 | 1.6 | 1.6 | 1.6 | 1.5 | 1.3 |
Table 16. Adjustment Coefficient γ Under Negative Pressure
The results show no clear functional relationship between θ and γ. However, they establish practical ranges for the adjustment coefficient under different pressure directions.
The study determines representative γ values using conditions near panel failure. Under positive pressure, Panel A has γ = 1.1 when θ = 58.1.
Panel B has γ = 1.3 when θ = 30.3 under positive pressure. Consequently, the positive-pressure adjustment coefficient ranges from 1.1 to 1.3.
Under negative pressure, the corresponding coefficient ranges from 1.3 to 1.5. These ranges reflect differences in support behavior and loading direction.
Comparison Between Calculated and Experimental Maximum Vertical Displacements
The study compares Equation (5), conventional Equation (1), and experimental measurements. Figures 19 through 21 illustrate the corresponding displacement relationships.
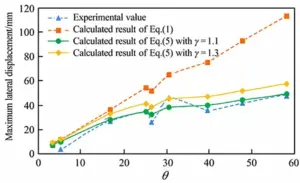
Under positive pressure, both equations produce results close to experimental measurements when θ does not exceed 20. Geometric nonlinear effects remain relatively limited in this range.
As θ increases, Equation (1) increasingly overestimates experimental displacement. In some cases, theoretical values exceed measured results by several times.
Equation (5) provides the closest agreement with positive-pressure experimental results when γ equals 1.1. This value therefore offers a practical adjustment for the tested panel configurations.
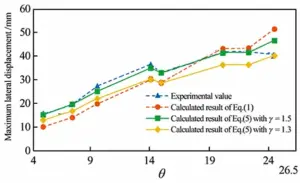
Under negative pressure, both equations produce results relatively close to experimental measurements. All negative-pressure cases have θ values no greater than 23.5.
Consequently, geometric nonlinear effects remain comparatively limited under the tested negative-pressure conditions. Equation (5) achieves the closest agreement when γ equals 1.5.
The study therefore recommends γ = 1.1 for positive pressure and γ = 1.5 for negative pressure. These values improve agreement between calculated and experimental maximum vertical displacements.
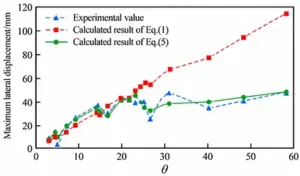
Figure 21 compares both equations with experimental measurements across the complete θ range. The comparison demonstrates the improved predictive performance of the adjusted displacement equation.
Conclusion
This study investigates U-shaped hollow Panels A and B with different structural configurations. It compares small-displacement theory, nonlinear finite element analysis, and experimental measurements.
The combined analysis establishes several conclusions concerning equivalent thickness, displacement reduction, adjustment coefficients, and geometric nonlinear effects.
Equivalent Thickness Based on Stiffness Equivalence
The study introduces an equivalent thickness concept based on bending stiffness equivalence. It also develops a calculation formula applicable to U-shaped hollow panels with different cavity configurations.
Equivalent thickness provides a criterion for evaluating large-displacement effects. It also replaces actual thickness in the conventional thin-plate displacement equation.
Maximum Vertical Displacement Calculation Formula
The proposed method introduces the displacement reduction coefficient η and adjustment coefficient γ. These parameters modify the conventional small-displacement equation to account for nonlinear deformation and support conditions.
The resulting formula is ω = γημqa4/D. This expression provides a calculation approach for the maximum vertical displacement of U-shaped hollow panels.
Displacement Reduction Coefficient Behavior
The displacement reduction coefficient follows a trend similar to those of glass and aluminum panels. As θ increases, η gradually approaches 0.30.
This behavior reflects the increasing influence of geometric nonlinearity. The proposed fitted equation represents the relationship between η and θ.
Recommended Adjustment Coefficients
The study recommends γ = 1.1 under positive pressure and γ = 1.5 under negative pressure. These values account for the tested support configurations and loading directions.
They also improve agreement between calculated and experimental displacement values. Their application should consider the structural conditions represented in this research.
Influence of Geometric Nonlinearity
When θ ≤ 20, geometric nonlinear effects remain relatively insignificant. Both conventional and modified equations produce maximum vertical displacement values close to experimental measurements.
When θ exceeds 20, the conventional equation increasingly deviates from experimental results. In contrast, the modified equation maintains substantially better agreement with measured displacement.
The study only examines U-shaped hollow panels with specific thicknesses and spans under positive and negative pressure. Its experimental sample size remains limited.
Further experimental verification and theoretical research are therefore necessary. Additional studies could expand the applicability of the proposed calculation method to other panel configurations and loading conditions.